...
The settings of this gadget are divided in 2 3 tabs:
Data tab - contains the required settings of the gadget, such as title or data source
More Settings tab - contains the optional settings, such as card colors
Colors tab - lets you customize the color of the lines displayed in the chart
Data tab
On this tab you can configure the required settings of the gadget.
...
Setting | Description |
|---|---|
"Done" means | Specify how the gadget should consider issues as done when determining the work completed. The default option is Issue is in last column of the selected board, which means that issues are considered done when they reach the last column of the board or, more exactly, a status that is mapped to the last board column. ChooseIssue is in one of these statuses, and then select one or more workflow statuses, to consider issues as done when they reach one of these custom statuses. |
Options for including sprints | The gadget displays the closed sprints, but you can choose to include only certain sprints or the active sprints. Check Only sprints whose names contain... and enter the text to match if you want only specific sprints to be displayed by the chart. This option is useful when you want to filter out some of the board's sprints. |
Show legend | Check this if you want the chart legend to be displayed. |
Tilted labels for x-axis (avoid overlapping) | Check this to avoid overlapping of the x-axis labels. |
Show data table | Check this option if you want a data table to be displayed along with the chart. The Data tab displays all the sprints along with the issues that affected their velocity. The issues that had zeros on all the columns are not displayed. 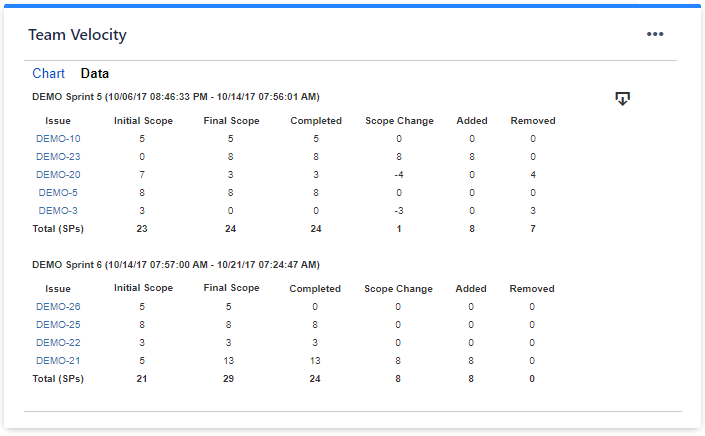  |
Display all series as lines | Check this option if you want the chart to have all the series displayed as lines (instead of bars). |
Display horizontal gridlines | Check this option if you want the chart to display gridlines for the vertical axis. |
Refresh cached data at next display | This gadget uses data caching for faster display, which means that some data resulted after processing are saved and reused next time the gadget is loaded. If you check it, the cache of the gadget will be deleted and recreated at the next reload. This setting is not persistent. |
Colors tab
On this tab
...
you can customize the color of the lines displayed in the chart.
...
Setting | Description |
|---|---|
Automatically assign colors | Check this if you want the chart to automatically assign colors for the series. |
Custom colors | Select any custom color you want the series to be displayed on by either entering the color's hexadecimal code or picking a color. You can also use the Copy and Import buttons to copy and import the color configuration to gadgets of the same type. |
...
The following blog articles provide more information on how to use this gadget.